Imagine if you had access to alternate data?
The edge is in the data. Every move has a time. We compute it.
Nine independent data sources that don't come from price.
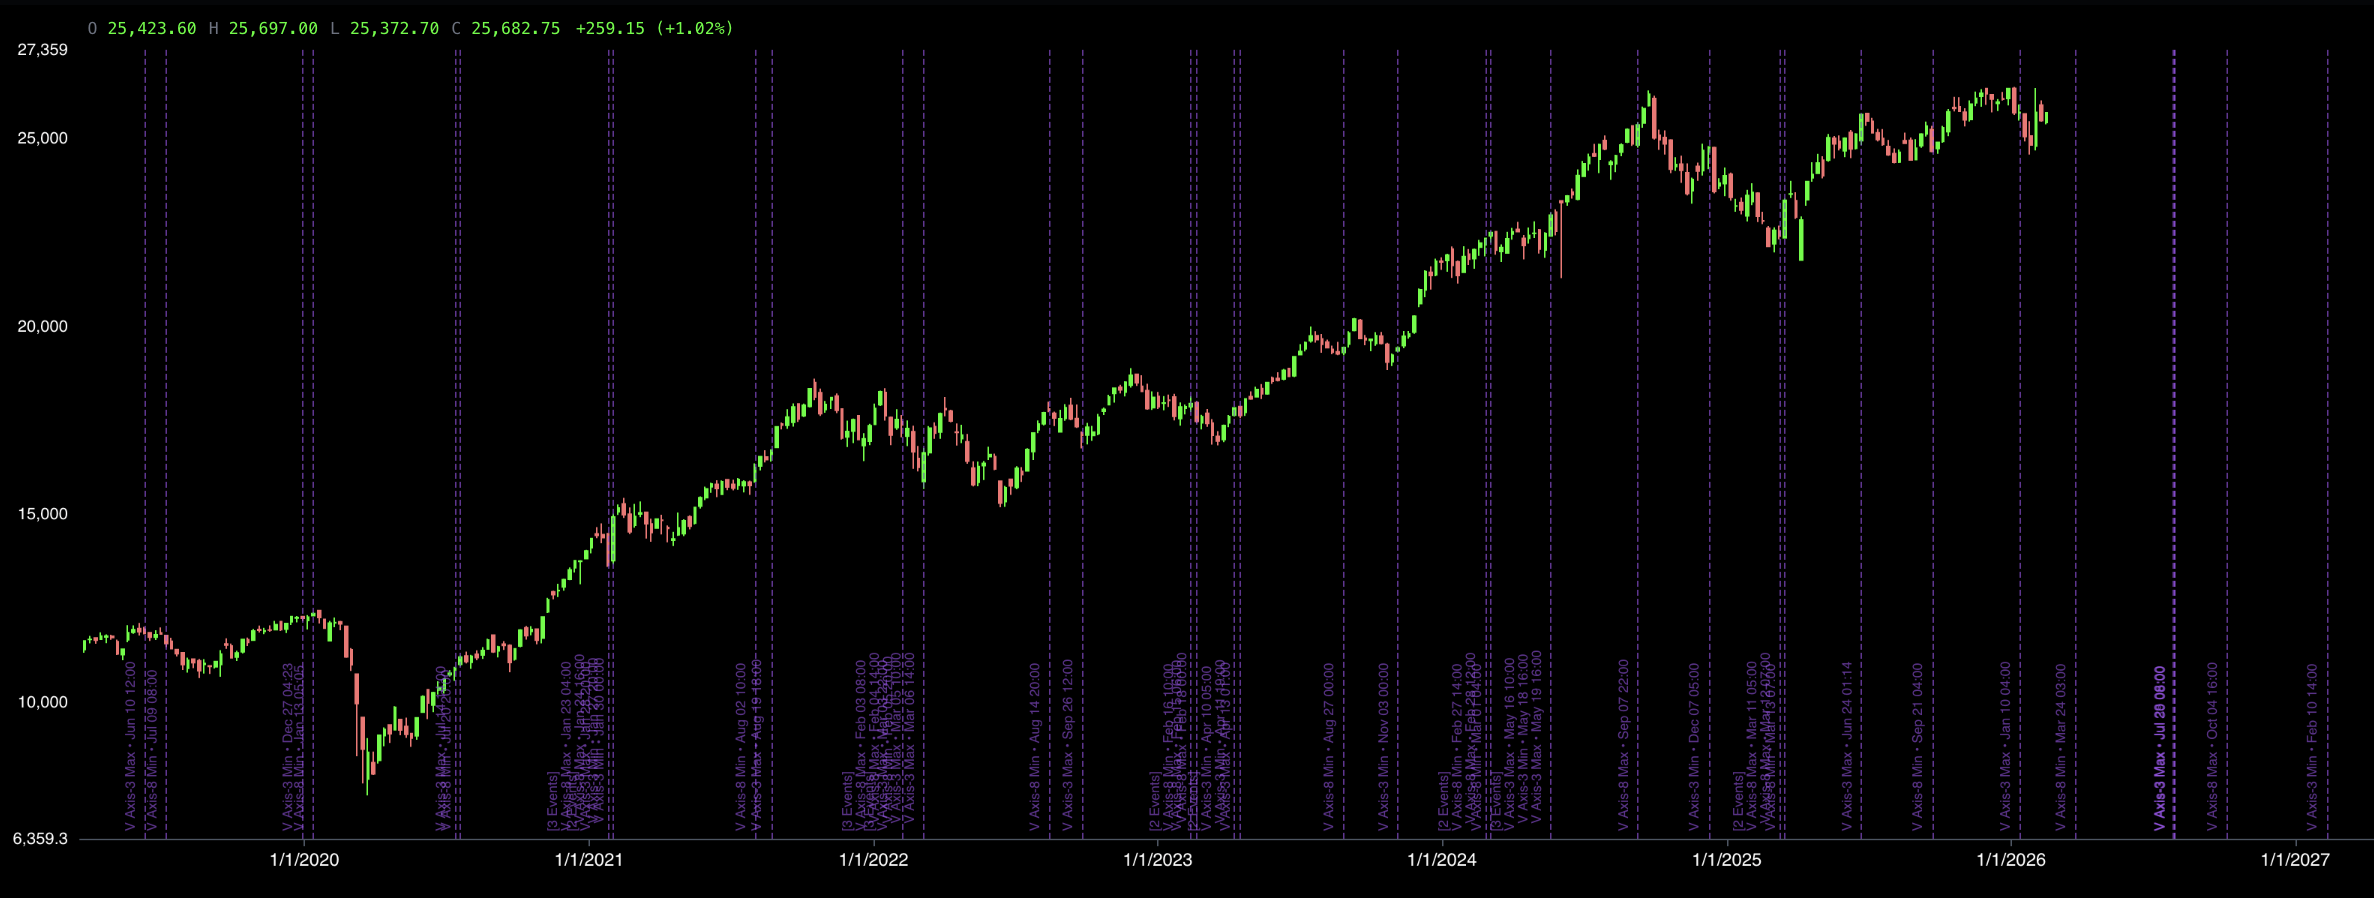
Nine data axes. Dozens of overlay models. Any ticker. Any timeframe.
Live terminal · ^NSEI daily · Overlay panel with 9 independent data axes
Last year, institutions spent $17B on alternative data.
0% of that reaches general market participants.
Everyone else gets the same RSI and MACD that 165 million users see on the same screen.
You deserve a different view.
"When 50 million users see the same divergence at the same time, the signal is worth nothing."
Nine independent data sources.
Zero derived from price.
We don't make predictions. We provide data that doesn't exist anywhere else and let you form your own hypotheses.
Exogenous
Data from outside the market. Not derived from price, volume, or any market variable.
Deterministic
Every data point is mathematically certain. Computable forward and backward. Known in advance.
Uncrowded
No other platform surfaces this data. A structural advantage that can't be arbitraged away.
Three steps.
That's it.
Pick your chart
Any ticker. Any timeframe. Chart across stocks, crypto, forex and indices, from 5-minute to quarterly candles, with full nine-axis coverage on 230+ instruments across 3 markets.
Add overlays
9 independent data axes. Up to 6 models per axis — longitude, velocity, declination, gravitational force. Build weighted composites that are unique to you.
See what others can’t
40 years of historical depth. Data that’s known in advance. Structural patterns invisible to price-only analysis. Form your own hypotheses.
THE
DATA.
9 independent, measurable phenomena — computed from first-principles physical models. The specific identity of these sources is our core IP.
Axis-1
Anchors macro direction. Use it to identify the dominant regime — trending or ranging.
Axis-2
Fast-frequency signal. Best for intraday and swing setups where timing matters most.
Axis-3
Long-duration macro cycle. Governs expansion and contraction phases across markets.
Axis-4
Reveals structural shifts invisible to price. Detects hidden liquidity and trend obfuscation.
Axis-5
Momentum-driven cycle. Identifies price-swing windows for active, directional positioning.
Axis-6
Mean-reversion nodes. Pinpoints equilibrium zones where trends exhaust and reverse.
Axis-7
Aggregate confluence. Composite of all independent axes — strongest when they align.
Axis-8
Structural floors and ceilings. Long-duration support and resistance from outside the market.
Axis-9
Energy bursts and breakouts. Identifies windows of acceleration before they appear in price.
9 independent data sources · none derived from price · computed with sub-arcsecond precision
See what the rest of the market can't.
Precise timestamps when structural shifts occur during market hours. Computed daily for NYSE, NSE, and LSE. Refreshed at 12:00 AM local time.
Code 1 — Intraday Timestamps
Code 1 publishes precise intraday timestamps marking when structural shifts occur during market hours. Timestamps are computed daily for NYSE, NSE and LSE, and refresh at 12:00 AM local time for each exchange.
Loading today’s timestamps…
$50/month.
Less than the spread on a single options trade.
Free
Chart terminal + limited overlays
- Real-time OHLC charts
- Symbol search and charting (100K+ tickers)
- Basic overlay access
- 5-day rolling data window
Plus
All 9 axes, all models, 40-year depth
- Everything in Free
- All 9 data axes
- All overlay models (up to 6 per axis)
- Weighted composite builder
- 40-year historical depth
- Unrestricted calendar access
- Full monthly data tables
- Downloadable CSV exports
Cancel anytime. No contracts. No credit card to start.
Common questions.
What is Three Axis?
Three Axis is an alternative data platform for market participants. It provides nine independent data sources as overlays on any chart, none of which are derived from price, volume or any other market variable. The product is a browser terminal at threeaxis.live, with a REST API and an MCP server for developers.
What is alternative data in trading?
Alternative data is any input that does not come from the market itself. Conventional indicators are transformations of price and volume, so everyone computing them is looking at the same underlying series. Alternative data originates outside the market, which is what makes it possible to see something the rest of the tape is not already seeing.
How is this different from indicators like RSI or MACD?
RSI and MACD are computed from price, so they cannot tell you anything price has not already told you, and roughly 165 million users are looking at the same readings on the same screens. The Three Axis sources are exogenous: they are measured independently of the market and are not a transformation of the chart you are looking at.
What makes the data different?
Three properties. It is exogenous, meaning it originates outside the market. It is deterministic, meaning every value is mathematically certain and computable both forward and backward, so it is known in advance rather than estimated. And it is uncrowded, because no other platform surfaces it, which is a structural advantage rather than one that gets arbitraged away.
What are the nine data axes?
Nine independent, measurable phenomena computed from first-principles physical models at sub-arcsecond precision. Each is published by what it is useful for rather than what it is: macro direction, fast-frequency timing, long-duration cycles, structural shifts invisible to price, momentum windows, mean-reversion nodes, aggregate confluence, structural floors and ceilings, and acceleration windows. The specific identity of the nine sources is the company core IP and is not published.
What is Code 1?
Code 1 publishes precise intraday timestamps marking when structural shifts occur during market hours. It is computed daily for NYSE, NSE and LSE, and refreshes at 12:00 AM local time for each exchange.
What markets and instruments does Three Axis cover?
The nine-axis data covers 230+ instruments across 3 markets, with 40 years of historical depth and intervals from five-minute candles to quarterly. The terminal also charts live prices across a much broader ticker universe spanning stocks, crypto, forex and indices, though the axis overlays apply to the covered instrument set.
How much does Three Axis cost?
There are two plans. Free covers real-time OHLC charts, symbol search and charting across 100,000+ tickers, basic overlay access and a 5-day rolling data window. Note that the 100,000+ figure is chartable tickers; the nine-axis data itself covers 230+ instruments across 3 markets. Plus is $50 per month and adds all nine data axes, all overlay models, the weighted composite builder, 40-year historical depth, unrestricted calendar access, full monthly data tables and downloadable CSV exports. No contract, cancel anytime, and no credit card is required to start.
Is there a free plan?
Yes. The free plan gives you the chart terminal, symbol search, basic overlay access and a 5-day rolling data window, with no credit card required.
Does Three Axis provide trading signals or investment advice?
No. Three Axis is an alternate data visualization platform. It does not provide investment advice, buy or sell signals, or financial recommendations, and all data is for informational purposes only. The platform supplies data and leaves interpretation to you.
Does Three Axis have an API?
Yes. A REST API is available under /v1 with Bearer token authentication, covering cyclic backtests and confluence signals, with an event calendar, overlay curves and webhooks in development. There is also an MCP server, so an LLM or agent client can query Three Axis data directly. Full reference is at threeaxis.live/docs.